
Revamp Detail Stock
From a pile of numbers to a page that helps you decide
- Company
- Phintraco Consulting
- Platform
- Mobile app
- Project
- Profits
- Year
- 2026
The Beginning
Detail Stock is where an investor decides. After scanning the market or a watchlist, they open one stock and ask three things: what is it, how is it doing, and should I act?
This revamp goes beyond a new look. We rethought the page’s structure, visual hierarchy and layout, and the design decisions behind them, so it answers those three questions in that order.
We started by holding the old screen up against the same rules as the rest of the app, and looking at what got in the way.
A stock page has one job
Help me decide, without making me hunt.
Measured against that job, three things stood in the way. They are also the three reasons this revamp happened.
Everything at the top, and nothing leading.
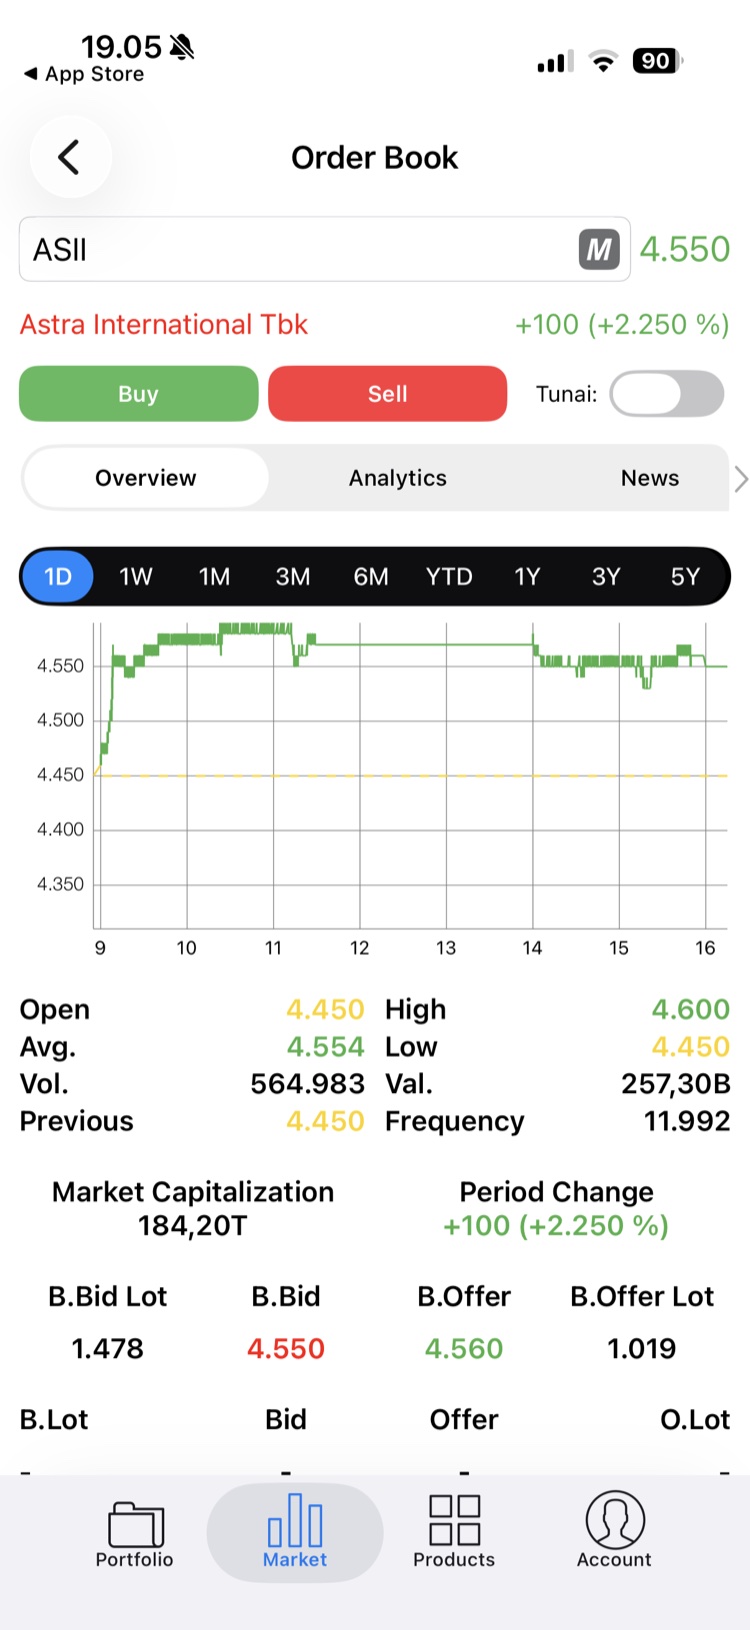
The screen was titled Order Book, whichever stock you opened. The stock itself was a search-style field and a company name in small red text, even when the price beside it was green.
Right below, Buy and Sell sat side by side at equal weight, next to an unlabelled “Tunai” toggle. By the time the tabs appeared, about a third of the screen was already used, and the data had not started.
A pile of numbers, with no way to read it.
Open, High, Low, Average, Volume, Value, Previous and Frequency were laid out as a loose grid, with labels and values alternating left and right. Market capitalisation, period change and the order book then followed in different styles, as if from different screens.
Colour added to the noise: yellow, green and black values side by side on white. Nothing said which number mattered most.
Four layers to reach one number.
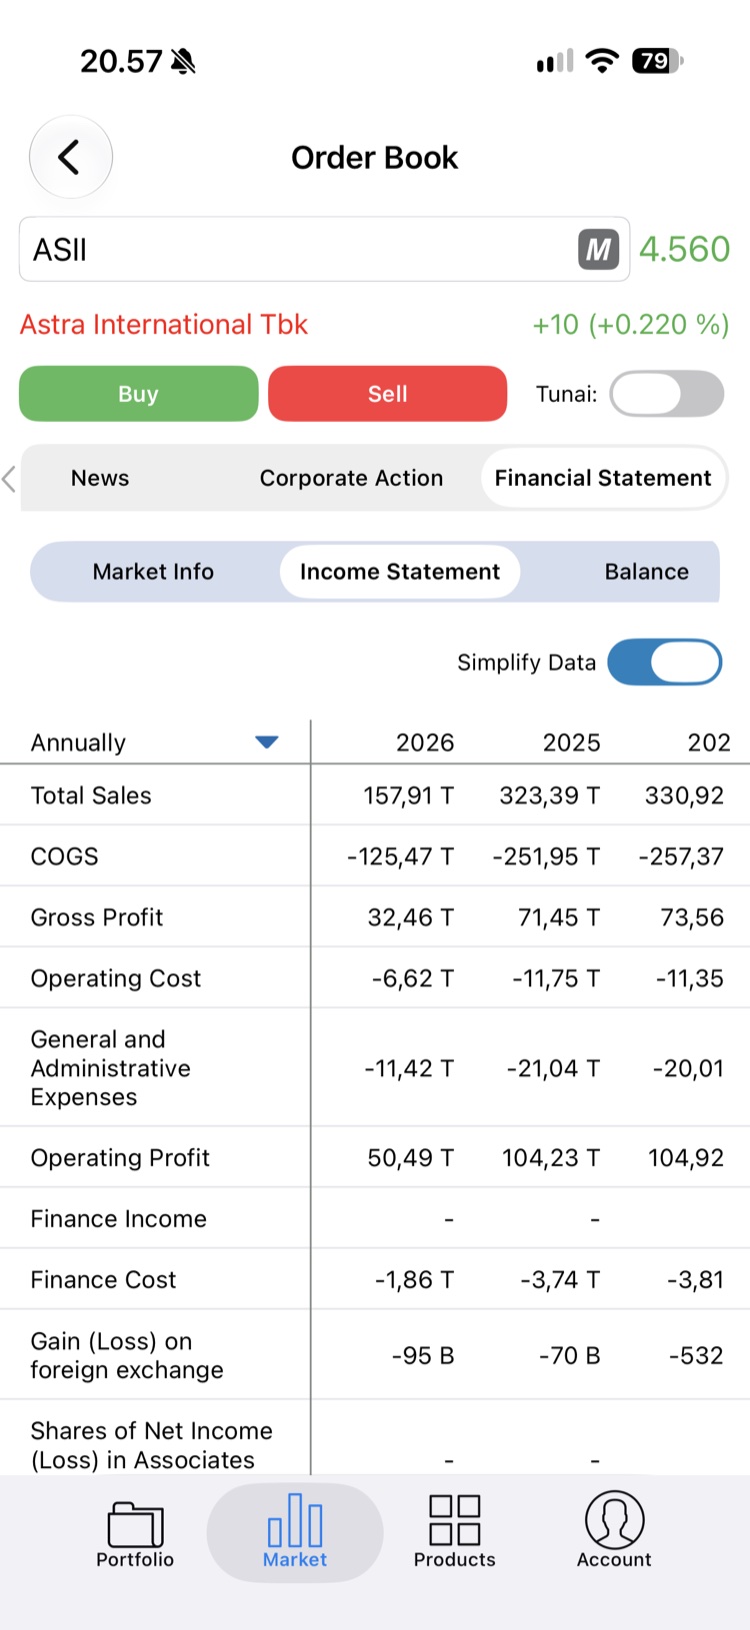
To read a company’s income, you went through Financial Statement, then Income Statement, then a Simplify Data toggle and a period picker. Each layer was its own row, and each scrolled sideways.
Rows were clipped at the edge: tabs half cut off, and the last year in the table shown as “202”. The content was there, but hard to reach and easy to misread.
So before drawing anything, the question became
What should a stock page show first?
The Journey
The solution
We kept the order of the investor’s questions and built the page around it: know the stock, then decide, then go deeper. The top of the page identifies the stock, the bottom of the page is where you act, and everything in between is organised so you can scan it.
The unique value
Know the stock at a glance, act in one tap, and go deeper only when you want to.
Identity first
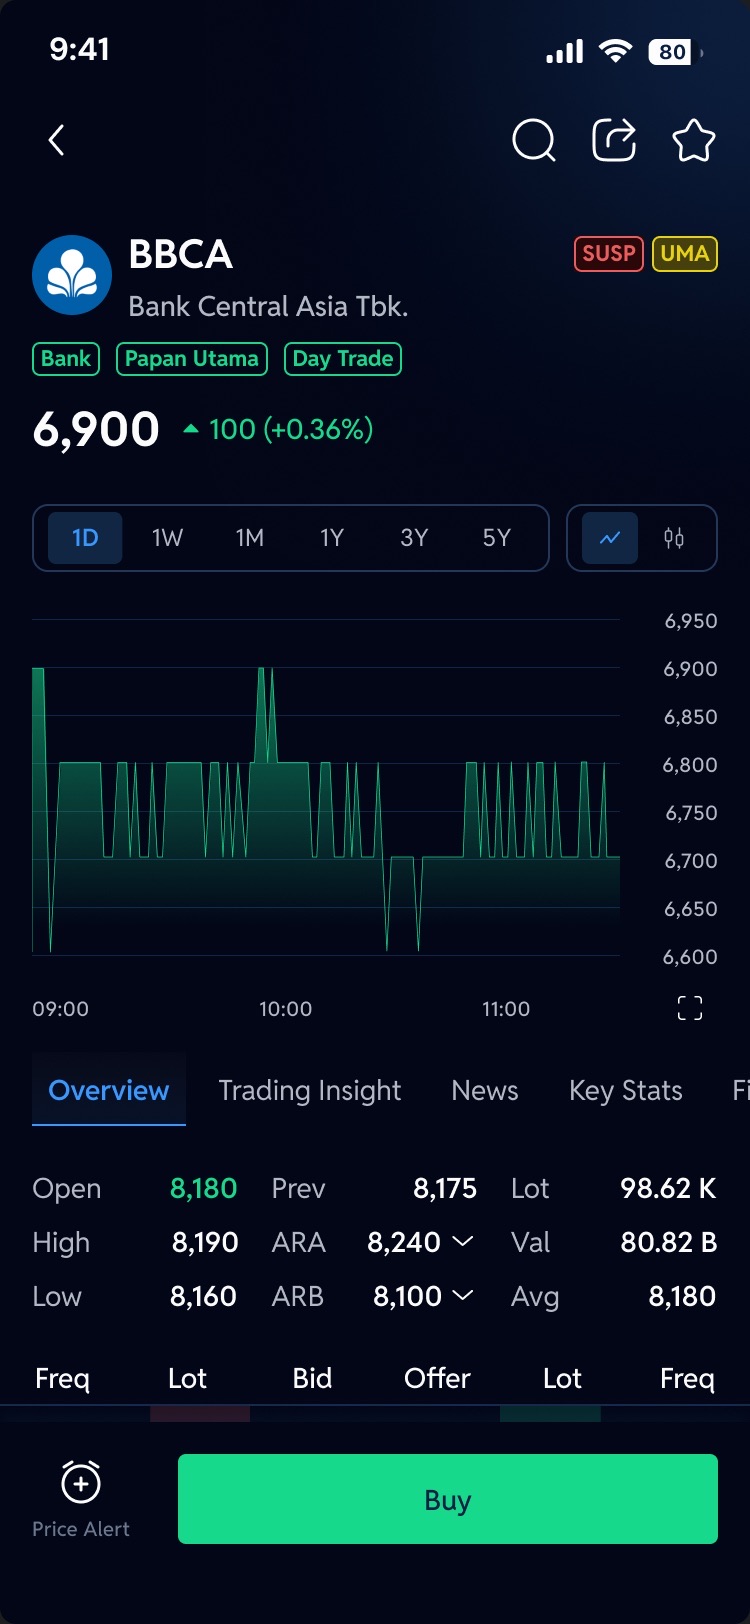
Logo, code and company name, with sector, board and trading type as small tags, then the price and its change in large type. The page says what it is before it says anything else. Status flags such as SUSP or UMA sit beside the code and explain themselves when tapped.
One decision bar
Price Alert and Buy stay pinned to the bottom, always in reach. Buy is the one primary action. Sell only appears when you hold the stock, together with a card showing your position.
One row of tabs
Overview, Trading Insight, News, Key Stats, Financials, Corp Action and Profile sit in a single row. What used to be three nested levels is now one tap plus a row of chips.
Beyond the first screen
With a clearer base, the rest of the page could be reorganised too. Each of these is designed as its own flow.
- 01
A clear order
Overview reads top to bottom: chart, key numbers, order book, running trade, trade book, broker summary, then foreign and domestic activity.
- 02
Context that follows you
Scroll down and the header condenses to the code and price, with the tabs pinned, so you never lose which stock you are reading.
- 03
Status in plain words
SUSP, FCA, UMA and similar flags sit next to the code and open a short explanation of each.
- 04
Colour only for movement
Green and red stay with price and market data. Blue marks what is selected or can be tapped.
- 05
Watchlist in one tap
The star in the header adds the stock to a watchlist, or to a new one, without leaving the page.
- 06
Price alerts
Set, update and delete an alert, and get a notification when the price is reached.
- 07
ARA and ARB at a glance
The auto-rejection limits open into a ladder from the upper to the lower limit.
- 08
Chart your way
A line or candlestick chart, a full TradingView chart when you need room, and sharing as an image.
Before and after, side by side
Watch the first screen change from the old Detail Stock to the revamp. Pause to hold either one, or drag to compare.
The Design
Every journey below plays by itself, straight from the final screens. When one journey ends, the next begins. Pick a journey to watch it, pause to look closer, or jump to any step.
The Ending
In the end, Detail Stock stopped being a page of data and became a decision.
An investor opening a stock now sees which stock it is, how it is doing and what they can do about it, before scrolling at all. The rest follows in an order that makes sense, one tap away, and the actions are always in reach.
Before the revamp
After the revamp
The hierarchy
A generic title and equal-weight buttons
→
The stock first, then one clear action
The information
Numbers in a loose grid
→
A structured page, from chart to broker activity
The navigation
Four nested layers
→
One row of tabs and chips
A stock page is not a data sheet. It is the moment a decision gets made.