
Revamp Watchlist
From a sheet of numbers to a watchlist you can read at a glance
- Company
- Phintraco Consulting
- Platform
- Mobile app
- Project
- Profits
- Year
- 2026
The Beginning
The Watchlist is where an investor keeps the stocks they care about. People open it for a few seconds, again and again, to check on what they follow.
This revamp is about the screen itself: its structure, visual hierarchy and layout, so that the Watchlist is easier to read and use every day. We started from the point of view the homepage already had, and this screen did not share it.
So we held the old screen up against the same rules, and looked at what got in the way.
A watchlist has one job
What is moving among the stocks I care about?
The old screen answered a different question: how much are they worth? Measured against the first one, three things stood in the way. They are also the three reasons this revamp happened.
The loudest number was the least useful one.
Each row ended with three lines: price, change and Total Value. Total Value was set in the darkest, heaviest text on the screen, so it won the eye. The numbers that answer is it moving? were pale beside it.
Colour made it harder. Codes came in green, orange and purple while price and change used green, yellow and red, with no key for either. One colour, two possible meanings. Yellow on white is also very hard to read, far below the contrast that guidelines recommend.
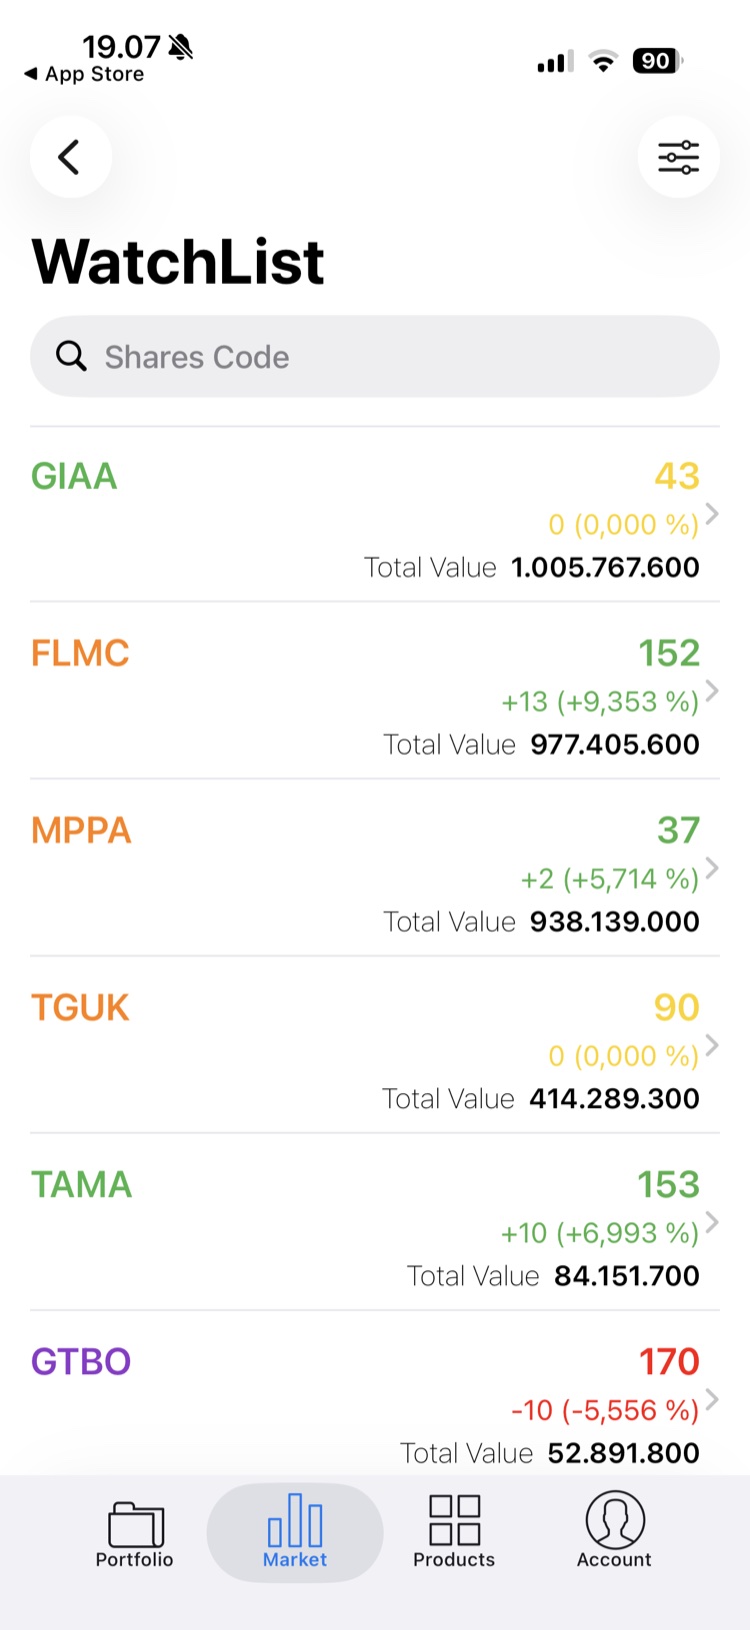
A code, some figures and nothing to hold on to.
Every row gave a code and numbers. No company name, no logo, no trend. A new investor had to remember what GIAA or TGUK were, and open each stock to see whether it was rising or falling.
Meanwhile the left half of each row sat empty and the figures piled up on the right. Space that could have told a story told nothing. The formatting did not help either: commas for decimals, dots for thousands, a stray space before every percent sign.
A watchlist you could look at, but not shape.
The screen had a back button, so it lived one level deep, inside Market, and not in the tab bar. The Market grid even had an item called IDX Watchlist, a separate feature with almost the same name.
On the screen itself the filter icon had no label, and the search field said “Shares Code” without saying whether it searched or added. There was no visible way to start a watchlist, add, sort or remove a stock.
So before drawing anything, the question became
What should a watchlist show first?
The Journey
The solution
We kept the logic of the homepage and applied it to a single watchlist: glanceable first, personal second, manageable third. The row comes first, because the row is what people read hundreds of times.
The unique value
A watchlist that tells you what moved, before you tap anything.
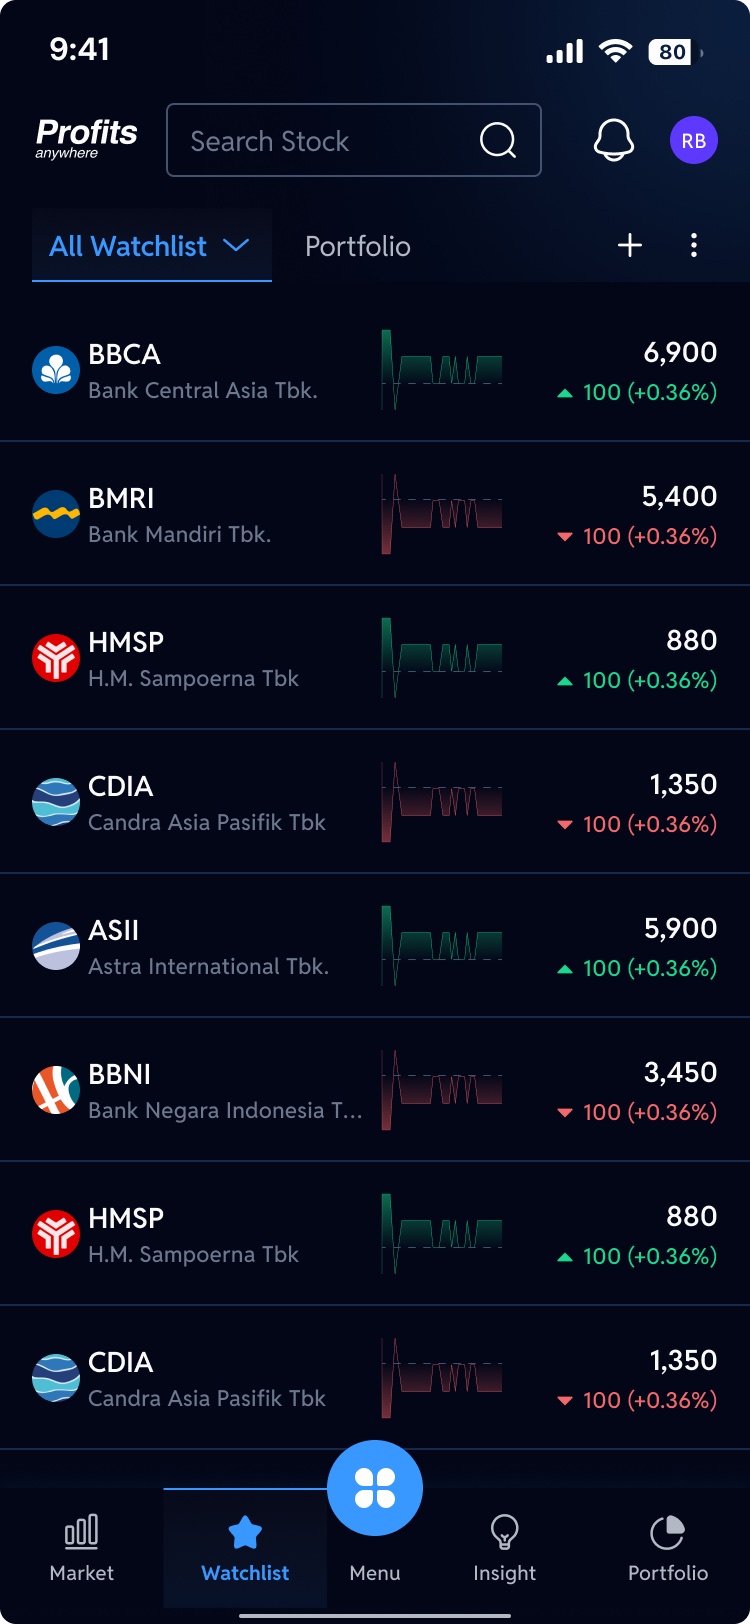
A row you read left to right
Logo, code and company name on the left, a small trend in the middle, price and change on the right. The name says what it is, the line says where it is heading, the numbers say how it did today.
Colour only for movement
Green and red belong to price and trend, nothing else, and blue means tap. One colour, one meaning. Total Value left the row altogether, so the numbers that matter are the ones that stand out.
Always one tap away
Watchlist now has its own tab in the bar, so it is one tap from anywhere. Up top, All Watchlist switches between watchlists, your favourite watchlists sit beside it as tabs, and + and ⋮ add and manage.
Beyond the watchlist
Once a watchlist is easy to read, people want to shape it. The revamp gives the Watchlist the tools it needs, each designed as its own flow.
- 01
Add a stock
From ready-made ideas, indexes and sectors, or straight from the search bar.
- 02
Switch the view
Choose how much to see: the default row, a complete view or a candlestick view.
- 03
Start a new watchlist
Group stocks into watchlists of your own.
- 04
Mark a favourite
Mark the watchlists you check most.
- 05
Edit a watchlist
Rename it, add or remove stocks, sort them or drag them into your own order.
- 06
Delete a watchlist
Remove a watchlist you no longer need, with a confirmation first.
- 07
Swipe for actions
Swipe a stock for Buy, plus Sell when you already hold it (the pie icon next to its code). Swipe the other way to delete.
- 08
Start from a clear empty state
A new watchlist says “You don’t have any stocks” and offers one obvious button: Add Stock.
Before and after, side by side
Watch the old Watchlist change into the revamp. Pause to hold either one, or drag to compare.
The Design
Every journey below plays by itself, straight from the final screens. When one journey ends, the next begins. Pick a journey to watch it, pause to look closer, or jump to any step.
The Ending
In the end, the Watchlist stopped being a table and became a glance.
An investor opening it now sees what each stock is, which way it is heading and how it did today, before tapping anything. Colour carries one meaning. And the watchlist sits one tap away, with the tools to make it their own.
Before the revamp
After the revamp
Reading
The loudest number was Total Value
→
The loudest numbers are price and change
The information
A code and a few figures
→
Logo, name, trend and price in one row
The control
A watchlist you could only look at
→
Watchlists you can add, sort, favourite and remove
A watchlist is not a spreadsheet. It is a glance you take many times a day.